Wellbore core data correction and integration
In the GeoLaB project, geological drill cores were captured on‑site with a line scanner. The rapidly generated image sequences exhibited inconsistent orientation, imprecise cropping, and uneven field markings, which hindered subsequent analysis. Consequently, a lightweight image‑processing framework was created to automatically orient, crop, and determine the geological “top/bottom” direction seen in the figure. Orientation is identified using the scanner’s characteristic black borders; thereafter, the true image boundaries are located from the top and bottom, and any excess margins are removed. To determine the upper and lower sides, the blue and red marking lines applied by the personnel are evaluated through FFT filtering of vertical structures and a 2D covariance analysis of the red and blue channels, with the relative channel shift revealing the physical top versus bottom position. The entire workflow is implemented in an automated pipeline that processes all scans, produces corrected files, and uploads them to the Kadi and MDIS servers, providing consistent data for further analysis and long‑term archiving.
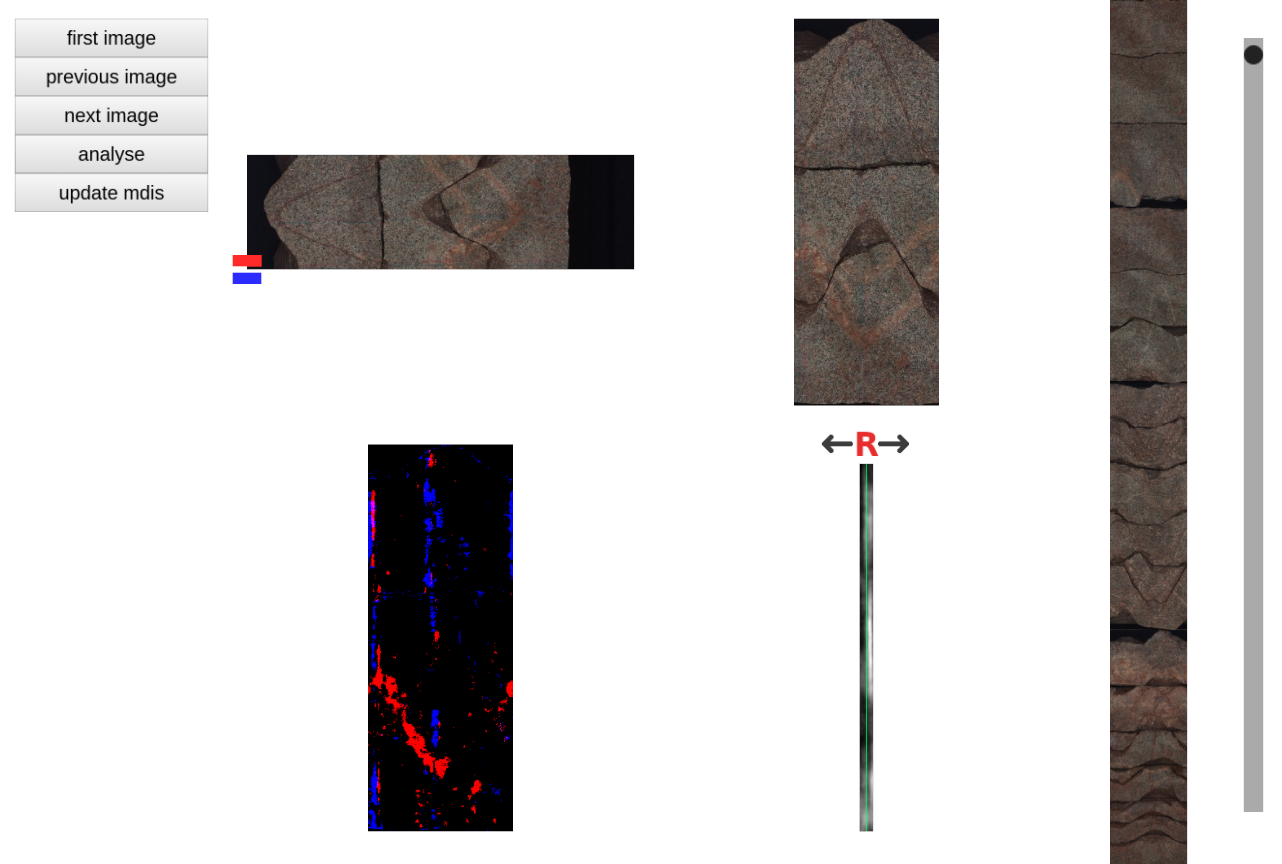
Top left: original image. Top right: transformed image. Bottom left: red and blue filter enhanced by FT based vertical feature analysis. Bottom right: covariance analysis to detect red to blue shift direction.
In parallel, the borehole log data exported from WellCAD in DLIS format were converted into a more compact, modern‑compatible format. A custom‑written script losslessly compresses the numerical curves, reorganizes the metadata, and simplifies their integration into other tools. This is complemented by an interactive visualization that displays log curves and borehole trajectories together in a unified 3D space, enabling the comparison of multiple wells. Both developments enhance data consistency, reduce manual effort, and provide reproducible methods for future datasets.