WP5 Software Engineering (SWE)
The aim of the GeoDT project is not only to develop individual software modules for the specific tasks of data integration, structure and process modeling, and visualization etc., but also to develop workflows in which the software modules can be linked together. During the reporting period, the first Jupyter notebooks for process simulation were developed. In addition, the visualization workflow was further developed and successfully applied for the first visualization study of the Tromm area (see video). The automation of repetitive work steps and a corresponding gain in efficiency in the creation and updating of visualization studies when new or updated data sets are available play an important role here. In addition to the existing components of the workflow, the KADI data management system has now been integrated. Furthermore, the development of an interactive visualization platform (GeoDT dashboard) has been started, also with a view to automating the link to Jupyter Notebooks (e.g., from structure and process modeling) in the future.
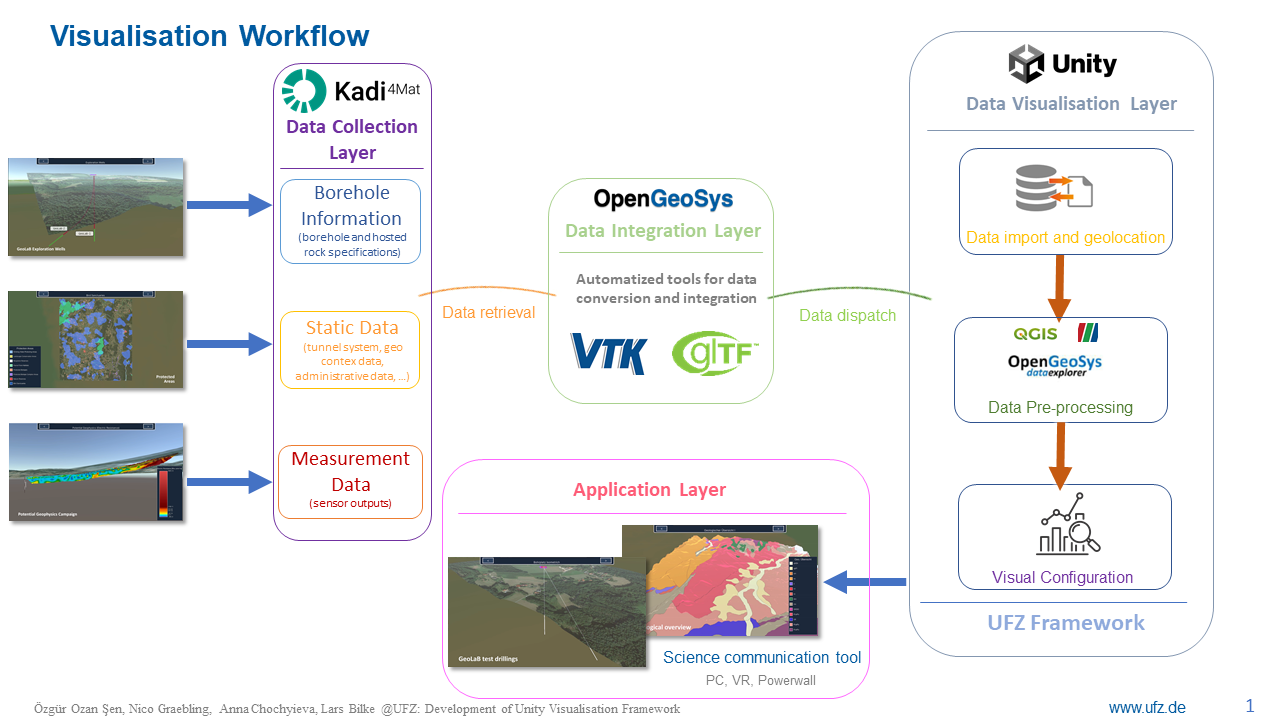
Visualisation Workflow and utilisation of the Unity Framework