Drilling Simulator Optimization
The GFZ borehole paths were visualized in PolyVR and exported as VTK models for the UFZ. When new measurement data were added to the second borehole, memory and startup time issues arose, prompting the introduction of a custom DLog format that enables more efficient data management and serves as the basis for a web version of the GeoLaB model.
For the 2D downhole logs, each meter section was saved as a PNG, and a level-of-detail (LoD) system was implemented to load images only when needed, reducing RAM usage and significantly shortening initialization time.
The initial RGB data (“Image-HS”) from the second borehole were offset row by row because they were recorded relative to the measuring device. An image analysis algorithm aligns the rows based on azimuth and magnetic north.
A 1D phase correlation method (Fourier-based) was integrated to precisely determine shifts between two discrete signals.
Both boreholes were incorporated into a common georeferenced model and supplemented with ABI data from GFZ, which includes fracture parameters (azimuth, dip, height, type, aperture), as shown in the figure. GFZ analyzed this data and created a dataset for the application used to visualize and interpret subsurface fractures.
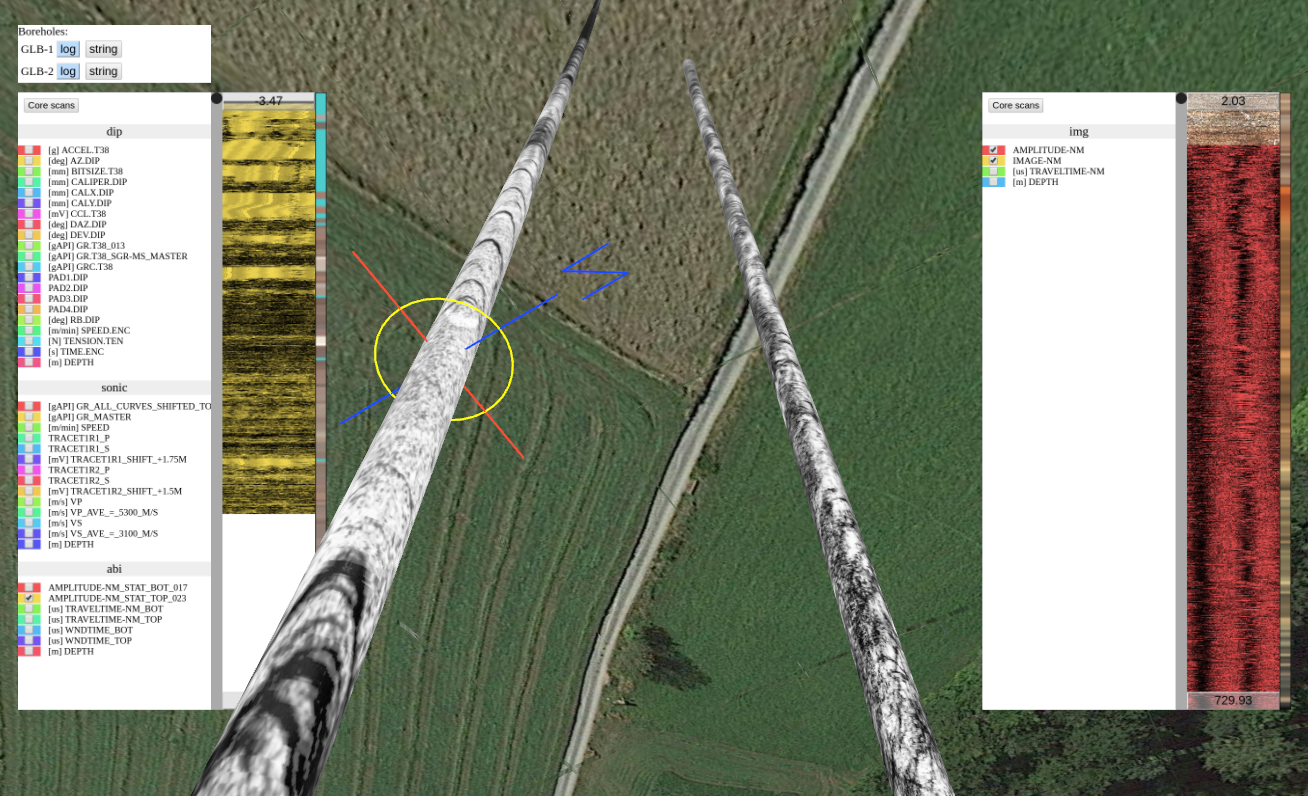
Boreholes, view towards the surface, mapped ABI data.
Optimized data structures, on-demand image loading, a robust alignment method, and integrated fracture analysis combine to create a resource-efficient, scalable virtual model tool for geotechnical borehole studies.